3. scRNA-seq Example
Examples to use GSEApy for scRNA-seq data
[1]:
%load_ext autoreload
%autoreload 2
import os
import numpy as np
import pandas as pd
import matplotlib.pyplot as plt
[2]:
import gseapy as gp
import scanpy as sc
[3]:
gp.__version__
[3]:
'1.1.5'
3.1. Read Demo Data
Convert demo data from seurat to scanpy
## R code
library(Seurat)
library(SeuratDisk)
ifnb = SeuratData::LoadData("ifnb")
SaveH5Seurat(ifnb, "ifnb.h5seurat", overwrite = T)
Convert("ifnb.h5seurat", "ifnb.h5ad", overwrite = T)
[4]:
adata = sc.read_h5ad("tests/data/ifnb.h5ad") # data from SeuratData::ifnb
[5]:
adata.obs.head()
[5]:
| orig.ident | nCount_RNA | nFeature_RNA | stim | seurat_annotations | |
|---|---|---|---|---|---|
| AAACATACATTTCC.1 | IMMUNE_CTRL | 3017.0 | 877 | CTRL | CD14 Mono |
| AAACATACCAGAAA.1 | IMMUNE_CTRL | 2481.0 | 713 | CTRL | CD14 Mono |
| AAACATACCTCGCT.1 | IMMUNE_CTRL | 3420.0 | 850 | CTRL | CD14 Mono |
| AAACATACCTGGTA.1 | IMMUNE_CTRL | 3156.0 | 1109 | CTRL | pDC |
| AAACATACGATGAA.1 | IMMUNE_CTRL | 1868.0 | 634 | CTRL | CD4 Memory T |
[6]:
adata.layers['counts'] = adata.X # Save raw counts
[7]:
# preprocessing
sc.pp.normalize_total(adata, target_sum=1e4)
sc.pp.log1p(adata)
#adata.layers['lognorm'] = adata.X
[8]:
adata.obs.groupby('seurat_annotations')['stim'].value_counts()
[8]:
seurat_annotations  stim
B                   STIM     571
                    CTRL     407
B Activated         STIM     203
                    CTRL     185
CD14 Mono           CTRL    2215
                    STIM    2147
CD16 Mono           STIM     537
                    CTRL     507
CD4 Memory T        STIM     903
                    CTRL     859
CD4 Naive T         STIM    1526
                    CTRL     978
CD8 T               STIM     462
                    CTRL     352
DC                  CTRL     258
                    STIM     214
Eryth               STIM      32
                    CTRL      23
Mk                  STIM     121
                    CTRL     115
NK                  STIM     321
                    CTRL     298
T activated         STIM     333
                    CTRL     300
pDC                 STIM      81
                    CTRL      51
Name: count, dtype: int64
[9]:
# set STIM as class 0, CTRL as class 1, to make categorical
adata.obs['stim'] = pd.Categorical(adata.obs['stim'], categories=["STIM", "CTRL"], ordered=True)
indices = adata.obs.sort_values(['seurat_annotations', 'stim']).index
adata = adata[indices,:]
[10]:
# # # subset and write GCT and CLS file
# outdir = "ifnb/"
# for cell in adata.obs.seurat_annotations.unique():
#     bdata = adata[adata.obs.seurat_annotations == cell ]
#     groups = bdata.obs['stim'].to_list()
#     cls_dict = bdata.obs['stim'].to_dict()
#     gs = bdata.to_df().T
#     gs.index.name = "NAME"

#     gs_std = gs.groupby(by=cls_dict, axis=1).std()
#     gs = gs[gs_std.sum(axis=1) > 0]
#     gs= gs + 1e-08  # we don't like zeros!!!

#     gs.insert(0, column="Description", value=cell,)
#     outname = os.path.join( outdir, cell + ".gct")
#     outcls = os.path.join(outdir, cell +".cls")
#     s_len = gs.shape[1] - 1
#     with open(outname,"w") as correct:
#         line1="#1.2\n"+f"{gs.shape[0]}\t{s_len}\n"
#         correct.write(line1)
#         gs.to_csv(correct, sep="\t")

#     with open(outcls, "w") as cl:
#         line = f"{len(groups)} 2 1\n# STIM CTRL\n"
#         cl.write(line)
#         cl.write(" ".join(groups) + "\n")
#     print(outname)
[11]:
# subset data
bdata = adata[adata.obs.seurat_annotations == "CD14 Mono"].copy()
bdata
[11]:
AnnData object with n_obs × n_vars = 4362 × 14053
    obs: 'orig.ident', 'nCount_RNA', 'nFeature_RNA', 'stim', 'seurat_annotations'
    var: 'features'
    uns: 'log1p'
    layers: 'counts'
3.2. GSEA
[12]:
import time
t1 = time.time()
# NOTE: To speed up, use gp.prerank instead with your own ranked list.
res = gp.gsea(data=bdata.to_df().T, # row -> genes, column-> samples
        gene_sets="GO_Biological_Process_2021",
        cls=bdata.obs.stim,
        permutation_num=1000,
        permutation_type='phenotype',
        outdir=None,
        method='s2n', # signal_to_noise
        threads= 16)
t2=time.time()
print(t2-t1)
/Users/fangzq/Github/GSEApy/gseapy/gsea.py:173: UserWarning: Boolean Series key will be reindexed to match DataFrame index.
  df = df[df_std.abs().sum(axis=1) > 0]
39.00995206832886
[13]:
res.res2d.head(10)
[13]:
| Name | Term | ES | NES | NOM p-val | FDR q-val | FWER p-val | Tag % | Gene % | Lead_genes | |
|---|---|---|---|---|---|---|---|---|---|---|
| 0 | gsea | cytokine-mediated signaling pathway (GO:0019221) | 0.685491 | 3.759972 | 0.0 | 0.0 | 0.0 | 99/490 | 5.14% | ISG15;IFIT3;IFIT1;RSAD2;ISG20;CXCL10;IFITM3;CX... |
| 1 | gsea | innate immune response (GO:0045087) | 0.784391 | 3.66143 | 0.0 | 0.0 | 0.0 | 52/188 | 5.33% | ISG15;IFIT1;CXCL10;IFITM3;APOBEC3A;MX1;IFI6;OA... |
| 2 | gsea | regulation of immune response (GO:0050776) | 0.759354 | 3.549856 | 0.0 | 0.0 | 0.0 | 42/140 | 6.07% | RSAD2;IRF7;PLSCR1;HERC5;IL4I1;SLAMF7;IFITM1;HL... |
| 3 | gsea | defense response to virus (GO:0051607) | 0.903464 | 3.438759 | 0.0 | 0.0 | 0.0 | 42/108 | 2.85% | ISG15;IFIT3;IFIT1;RSAD2;ISG20;CXCL10;IFITM3;AP... |
| 4 | gsea | response to cytokine (GO:0034097) | 0.718931 | 3.37735 | 0.0 | 0.0 | 0.0 | 31/120 | 4.49% | ISG15;IFITM3;MX1;IFITM2;PLSCR1;MX2;BST2;EIF2AK... |
| 5 | gsea | defense response to symbiont (GO:0140546) | 0.904717 | 3.362051 | 0.0 | 0.0 | 0.0 | 41/100 | 2.85% | ISG15;IFIT3;IFIT1;RSAD2;ISG20;IFITM3;APOBEC3A;... |
| 6 | gsea | cellular response to interferon-gamma (GO:0071... | 0.792726 | 3.327923 | 0.0 | 0.0 | 0.0 | 49/99 | 7.18% | CCL8;OAS1;MT2A;OASL;IRF7;GBP1;GBP4;CCL2;OAS3;O... |
| 7 | gsea | regulation of interferon-beta production (GO:0... | 0.856704 | 3.259412 | 0.0 | 0.0 | 0.0 | 14/44 | 4.94% | ISG15;OAS1;IRF7;DDX58;IFIH1;OAS3;OAS2;DHX58;HS... |
| 8 | gsea | RNA splicing, via transesterification reaction... | -0.626583 | -3.225436 | 0.0 | 0.0 | 0.0 | 128/234 | 19.45% | YBX1;PABPC1;HNRNPA1;DDX5;SRSF9;HNRNPM;RBMX;SF3... |
| 9 | gsea | gene expression (GO:0010467) | -0.70455 | -3.219153 | 0.0 | 0.0 | 0.0 | 134/322 | 10.13% | RPL6;RPL7;RPL15;RPL10;RPS3A;RPS6;RPL8;RPL21;RP... |
[14]:
res.ranking.shape # raking metric
[14]:
(13216,)
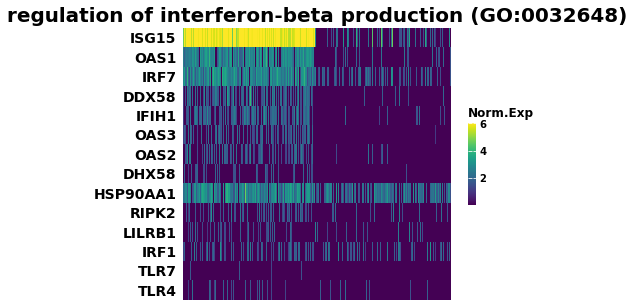
[15]:
## Heatmap of gene expression
i = 7
genes = res.res2d.Lead_genes.iloc[i].split(";")
ax = gp.heatmap(df = res.heatmat.loc[genes],
           z_score=None,
           title=res.res2d.Term.iloc[i],
           figsize=(6,5),
           cmap=plt.cm.viridis,
           xticklabels=False)
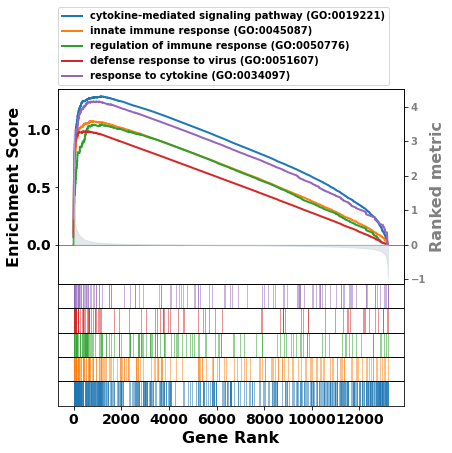
[16]:
term = res.res2d.Term
# gp.gseaplot(res.ranking, term=term[i], **res.results[term[i]])
axs = res.plot(terms=term[:5])
[ ]:
3.3. DEG Analysis
[17]:
# find degs
sc.tl.rank_genes_groups(bdata,
                        groupby='stim',
                        use_raw=False,
                        method='wilcoxon',
                        groups=["STIM"],
                        reference='CTRL')
[18]:
sc.pl.rank_genes_groups(bdata, n_genes=25, sharey=False)
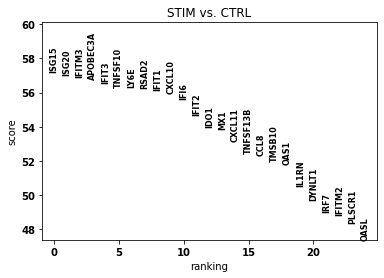
[19]:
# get deg result
result = bdata.uns['rank_genes_groups']
groups = result['names'].dtype.names
degs = pd.DataFrame(
    {group + '_' + key: result[key][group]
    for group in groups for key in ['names','scores', 'pvals','pvals_adj','logfoldchanges']})
[20]:
degs.head()
[20]:
| STIM_names | STIM_scores | STIM_pvals | STIM_pvals_adj | STIM_logfoldchanges | |
|---|---|---|---|---|---|
| 0 | ISG15 | 57.165920 | 0.0 | 0.0 | 8.660480 |
| 1 | ISG20 | 57.010384 | 0.0 | 0.0 | 6.850681 |
| 2 | IFITM3 | 56.890392 | 0.0 | 0.0 | 6.320490 |
| 3 | APOBEC3A | 56.770397 | 0.0 | 0.0 | 6.616682 |
| 4 | IFIT3 | 56.569122 | 0.0 | 0.0 | 8.313443 |
3.3.1. Prerank
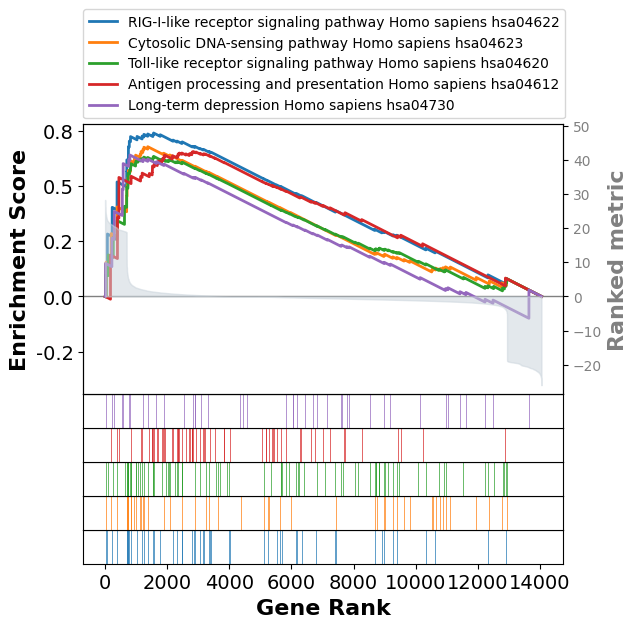
[21]:
pre_res = gp.prerank(degs.loc[:,['STIM_names', 'STIM_logfoldchanges']], gene_sets='KEGG_2016')
2025-02-04 15:49:59,570 [WARNING] Duplicated values found in preranked stats: 6.95% of genes
The order of those genes will be arbitrary, which may produce unexpected results.
[22]:
pre_res.res2d.head(5)
[22]:
| Name | Term | ES | NES | NOM p-val | FDR q-val | FWER p-val | Tag % | Gene % | Lead_genes | |
|---|---|---|---|---|---|---|---|---|---|---|
| 0 | prerank | RIG-I-like receptor signaling pathway Homo sap... | 0.739246 | 1.72491 | 0.00625 | 0.099502 | 0.068 | 16/52 | 11.12% | IFNB1;IFNE;IFNW1;IKBKG;CXCL10;ISG15;DDX58;DHX5... |
| 1 | prerank | Cytosolic DNA-sensing pathway Homo sapiens hsa... | 0.677289 | 1.599571 | 0.003226 | 0.377562 | 0.391 | 16/49 | 9.78% | IFNB1;POLR3B;IKBKG;CXCL10;ZBP1;IL6;DDX58;IRF7;... |
| 2 | prerank | Toll-like receptor signaling pathway Homo sapi... | 0.633578 | 1.584673 | 0.0 | 0.303049 | 0.454 | 23/87 | 11.12% | IFNB1;TLR3;PIK3R3;IKBKG;CTSK;CXCL10;CXCL11;IL6... |
| 3 | prerank | Antigen processing and presentation Homo sapie... | 0.655068 | 1.568956 | 0.003289 | 0.274653 | 0.501 | 31/64 | 20.25% | KIR2DL4;KLRC2;KIR3DL1;HSPA1A;KLRC1;TAP1;PSME2;... |
| 4 | prerank | Long-term depression Homo sapiens hsa04730 | 0.639757 | 1.470933 | 0.021212 | 0.590469 | 0.837 | 7/43 | 5.68% | GUCY1A3;PLCB4;PLCB2;GNA11;IGF1;GUCY1B3;CACNA1A |
[23]:
term2 = pre_res.res2d.Term
axes = pre_res.plot(terms=term2[:5])
3.4. Over-representation analysis (Enrichr API)
[24]:
# subset up or down regulated genes
degs_sig = degs[degs.STIM_pvals_adj < 0.05]
degs_up = degs_sig[degs_sig.STIM_logfoldchanges > 0]
degs_dw = degs_sig[degs_sig.STIM_logfoldchanges < 0]
[25]:
degs_up.shape
[25]:
(687, 5)
[26]:
degs_dw.shape
[26]:
(1030, 5)
[27]:
# Enricr API
enr_up = gp.enrichr(degs_up.STIM_names,
                    gene_sets='GO_Biological_Process_2021',
                    outdir=None)
[28]:
# trim (go:...)
enr_up.res2d.Term = enr_up.res2d.Term.str.split(" \(GO").str[0]
<>:2: SyntaxWarning: invalid escape sequence '\('
<>:2: SyntaxWarning: invalid escape sequence '\('
/var/folders/hp/199f0v0n5097qlbwt_5wp4dm0000gp/T/ipykernel_68875/3113486406.py:2: SyntaxWarning: invalid escape sequence '\('
  enr_up.res2d.Term = enr_up.res2d.Term.str.split(" \(GO").str[0]
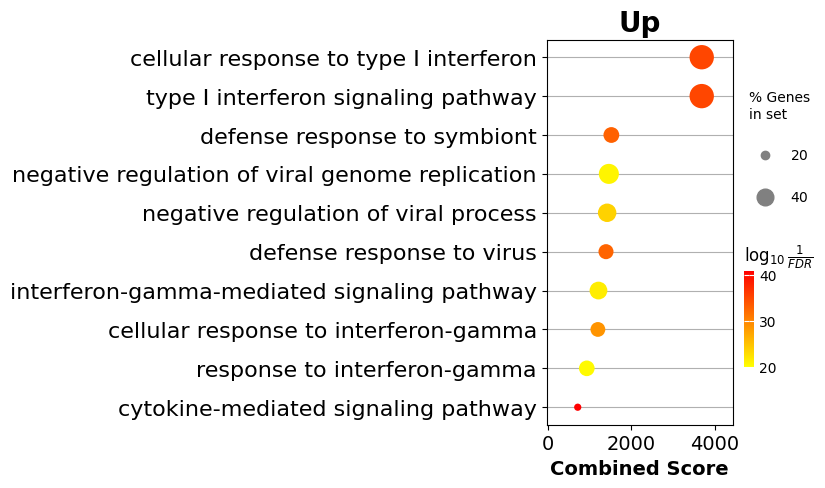
[29]:
# dotplot
gp.dotplot(enr_up.res2d, figsize=(3,5), title="Up", cmap = plt.cm.autumn_r)
plt.show()
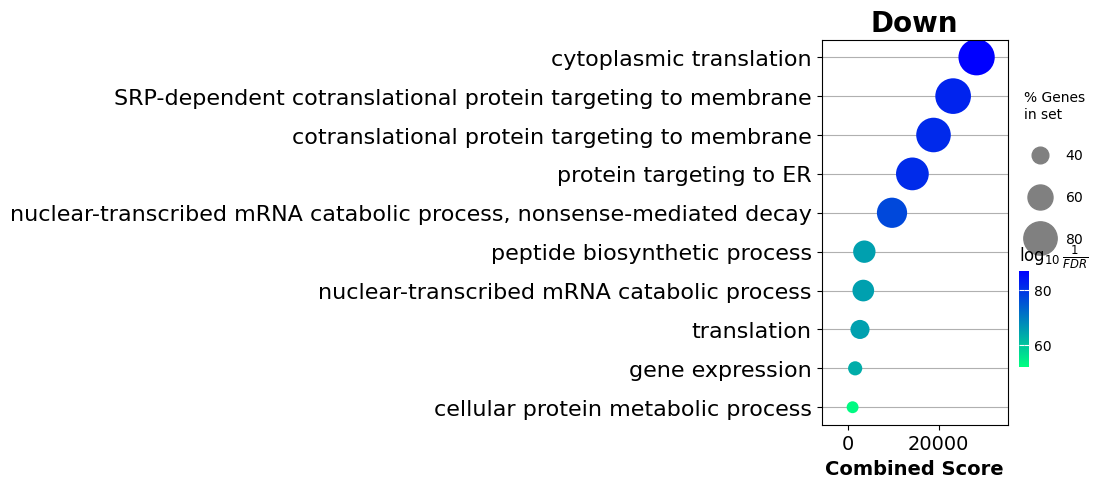
[30]:
enr_dw = gp.enrichr(degs_dw.STIM_names,
                    gene_sets='GO_Biological_Process_2021',
                    outdir=None)
[31]:
enr_dw.res2d.Term = enr_dw.res2d.Term.str.split(" \(GO").str[0]
gp.dotplot(enr_dw.res2d,
           figsize=(3,5),
           title="Down",
           cmap = plt.cm.winter_r,
           size=5)
plt.show()
<>:1: SyntaxWarning: invalid escape sequence '\('
<>:1: SyntaxWarning: invalid escape sequence '\('
/var/folders/hp/199f0v0n5097qlbwt_5wp4dm0000gp/T/ipykernel_68875/1100866918.py:1: SyntaxWarning: invalid escape sequence '\('
  enr_dw.res2d.Term = enr_dw.res2d.Term.str.split(" \(GO").str[0]
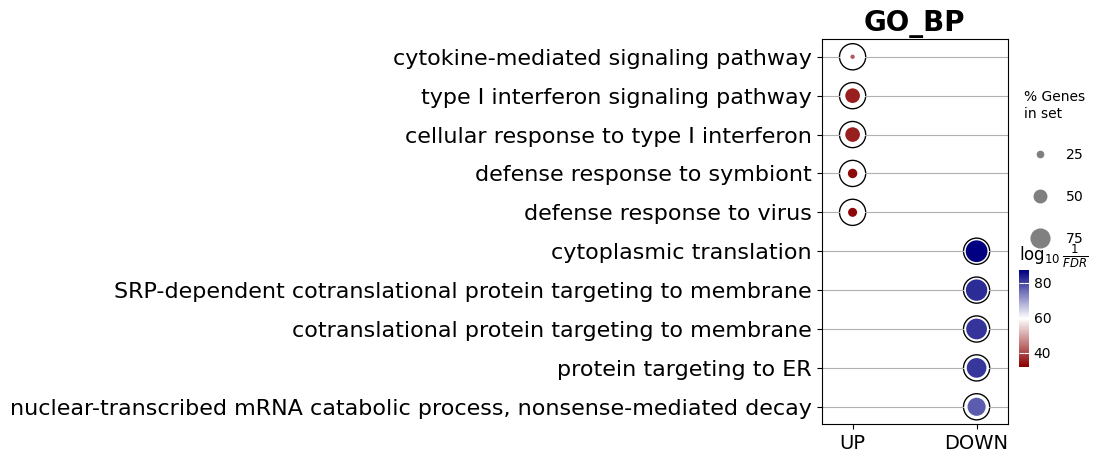
[32]:
# concat results
enr_up.res2d['UP_DW'] = "UP"
enr_dw.res2d['UP_DW'] = "DOWN"
enr_res = pd.concat([enr_up.res2d.head(), enr_dw.res2d.head()])
[33]:
from gseapy.scipalette import SciPalette
sci = SciPalette()
NbDr = sci.create_colormap()
# NbDr
[34]:
# display multi-datasets
ax = gp.dotplot(enr_res,figsize=(3,5),
                x='UP_DW',
                x_order = ["UP","DOWN"],
                title="GO_BP",
                cmap = NbDr.reversed(),
                size=3,
                show_ring=True)
ax.set_xlabel("")
plt.show()
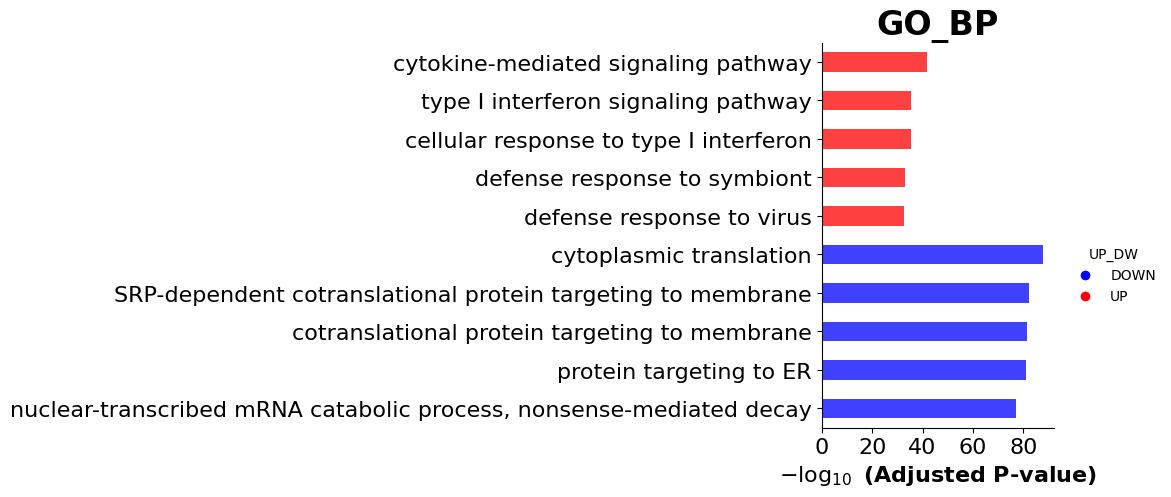
[35]:
ax = gp.barplot(enr_res, figsize=(3,5),
                group ='UP_DW',
                title ="GO_BP",
                color = ['b','r'])
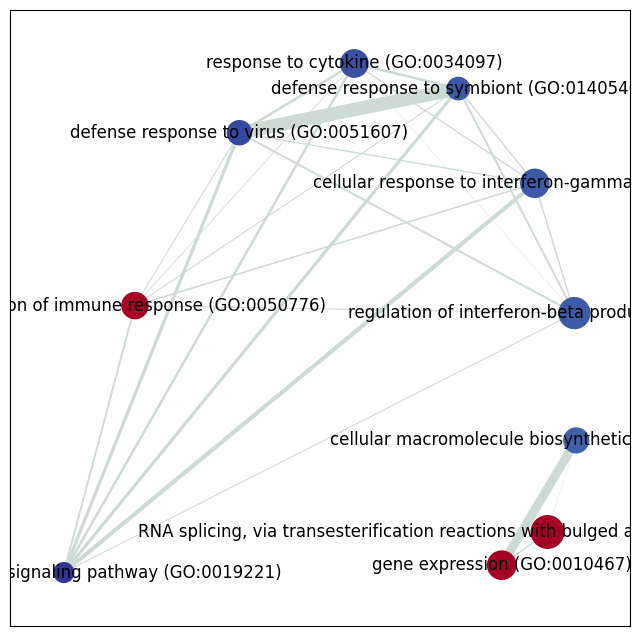
3.5. Network Visualization
[36]:
import networkx as nx
[37]:
res.res2d.head()
[37]:
| Name | Term | ES | NES | NOM p-val | FDR q-val | FWER p-val | Tag % | Gene % | Lead_genes | |
|---|---|---|---|---|---|---|---|---|---|---|
| 0 | gsea | cytokine-mediated signaling pathway (GO:0019221) | 0.685491 | 3.759972 | 0.0 | 0.0 | 0.0 | 99/490 | 5.14% | ISG15;IFIT3;IFIT1;RSAD2;ISG20;CXCL10;IFITM3;CX... |
| 1 | gsea | innate immune response (GO:0045087) | 0.784391 | 3.66143 | 0.0 | 0.0 | 0.0 | 52/188 | 5.33% | ISG15;IFIT1;CXCL10;IFITM3;APOBEC3A;MX1;IFI6;OA... |
| 2 | gsea | regulation of immune response (GO:0050776) | 0.759354 | 3.549856 | 0.0 | 0.0 | 0.0 | 42/140 | 6.07% | RSAD2;IRF7;PLSCR1;HERC5;IL4I1;SLAMF7;IFITM1;HL... |
| 3 | gsea | defense response to virus (GO:0051607) | 0.903464 | 3.438759 | 0.0 | 0.0 | 0.0 | 42/108 | 2.85% | ISG15;IFIT3;IFIT1;RSAD2;ISG20;CXCL10;IFITM3;AP... |
| 4 | gsea | response to cytokine (GO:0034097) | 0.718931 | 3.37735 | 0.0 | 0.0 | 0.0 | 31/120 | 4.49% | ISG15;IFITM3;MX1;IFITM2;PLSCR1;MX2;BST2;EIF2AK... |
[38]:
# res.res2d.to_csv("data/test.out.txt", sep="\t", index=False)
[39]:
nodes, edges = gp.enrichment_map(res.res2d)
/Users/fangzq/Github/GSEApy/gseapy/plot.py:738: FutureWarning: Downcasting behavior in `replace` is deprecated and will be removed in a future version. To retain the old behavior, explicitly call `result.infer_objects(copy=False)`. To opt-in to the future behavior, set `pd.set_option('future.no_silent_downcasting', True)`
  df[self.colname] = df[self.colname].replace(0, np.nan).bfill()
[40]:
nodes.head()
[40]:
| Name | Term | ES | NES | NOM p-val | FDR q-val | FWER p-val | Tag % | Gene % | Lead_genes | p_inv | Hits_ratio | |
|---|---|---|---|---|---|---|---|---|---|---|---|---|
| node_idx | ||||||||||||
| 0 | gsea | gene expression (GO:0010467) | -0.70455 | -3.219153 | 0.0 | 0.000009 | 0.0 | 134/322 | 10.13% | RPL6;RPL7;RPL15;RPL10;RPS3A;RPS6;RPL8;RPL21;RP... | 5.061359 | 0.416149 |
| 1 | gsea | RNA splicing, via transesterification reaction... | -0.626583 | -3.225436 | 0.0 | 0.000009 | 0.0 | 128/234 | 19.45% | YBX1;PABPC1;HNRNPA1;DDX5;SRSF9;HNRNPM;RBMX;SF3... | 5.061359 | 0.547009 |
| 2 | gsea | regulation of interferon-beta production (GO:0... | 0.856704 | 3.259412 | 0.0 | 0.000009 | 0.0 | 14/44 | 4.94% | ISG15;OAS1;IRF7;DDX58;IFIH1;OAS3;OAS2;DHX58;HS... | 5.061359 | 0.318182 |
| 3 | gsea | cellular response to interferon-gamma (GO:0071... | 0.792726 | 3.327923 | 0.0 | 0.000009 | 0.0 | 49/99 | 7.18% | CCL8;OAS1;MT2A;OASL;IRF7;GBP1;GBP4;CCL2;OAS3;O... | 5.061359 | 0.494949 |
| 4 | gsea | defense response to symbiont (GO:0140546) | 0.904717 | 3.362051 | 0.0 | 0.000009 | 0.0 | 41/100 | 2.85% | ISG15;IFIT3;IFIT1;RSAD2;ISG20;IFITM3;APOBEC3A;... | 5.061359 | 0.410000 |
[41]:
edges.head()
[41]:
| src_idx | targ_idx | src_name | targ_name | jaccard_coef | overlap_coef | overlap_genes | |
|---|---|---|---|---|---|---|---|
| 0 | 0 | 1 | gene expression (GO:0010467) | RNA splicing, via transesterification reaction... | 0.110169 | 0.203125 | NCBP2,DDX39A,SRSF2,POLR2L,SNRNP40,SRSF5,POLR2G... |
| 1 | 0 | 8 | gene expression (GO:0010467) | cellular macromolecule biosynthetic process (G... | 0.645390 | 0.928571 | RPS8,RPL12,RPS16,RPL23,RPL27A,MRPL51,MRPL43,RP... |
| 2 | 1 | 8 | RNA splicing, via transesterification reaction... | cellular macromolecule biosynthetic process (G... | 0.022624 | 0.051020 | POLR2J,POLR2G,POLR2E,POLR2L,POLR2F |
| 3 | 2 | 3 | regulation of interferon-beta production (GO:0... | cellular response to interferon-gamma (GO:0071... | 0.105263 | 0.428571 | IRF1,OAS1,OAS2,IRF7,OAS3,TLR4 |
| 4 | 2 | 4 | regulation of interferon-beta production (GO:0... | defense response to symbiont (GO:0140546) | 0.145833 | 0.500000 | OAS1,OAS2,IFIH1,ISG15,IRF7,OAS3,DDX58 |
[42]:
# build graph
G = nx.from_pandas_edgelist(edges,
                            source='src_idx',
                            target='targ_idx',
                            edge_attr=['jaccard_coef', 'overlap_coef', 'overlap_genes'])

# Add missing node if there is any
for node in nodes.index:
    if node not in G.nodes():
        G.add_node(node)
[43]:
fig, ax = plt.subplots(figsize=(8, 8))

# init node cooridnates
pos=nx.layout.spiral_layout(G)
#node_size = nx.get_node_attributes()
# draw node
nx.draw_networkx_nodes(G,
                       pos=pos,
                       cmap=plt.cm.RdYlBu,
                       node_color=list(nodes.NES),
                       node_size=list(nodes.Hits_ratio *1000))
# draw node label
nx.draw_networkx_labels(G,
                        pos=pos,
                        labels=nodes.Term.to_dict())
# draw edge
edge_weight = nx.get_edge_attributes(G, 'jaccard_coef').values()
nx.draw_networkx_edges(G,
                       pos=pos,
                       width=list(map(lambda x: x*10, edge_weight)),
                       edge_color='#CDDBD4')
plt.show()
[ ]: